Crime rate forecasting
Crime rates significantly impact the well-being and safety of communities. Traditional methods of crime analysis, relying on human interpretation of historical data, struggle to keep pace with the ever-growing volume of crime information. This limitation hindersproactive crime prevention efforts and resource allocation for law enforcement agencies. The current challenge lies in developing a more accurate and efficient method for forecasting crime rates. Existing crime prediction models might not fully capture the complex underlying patterns within vast datasets. This project aims to address this challenge by developing a robust machine learning model for crime rate prediction in Chicago. The model will leverage the Facebook Prophet framework and historical crime data from the Chicago Police Department's CLEAR system to identify trends and patterns.
Dataset Description
The dataset comprises 1000 rows and 23 columns, providing a detailed overview of reported incidents within the City of Chicago. Each row represents a specific incident, while the columns contain attributes such as crime type, location, date and time of occurrence, involved parties, and contextual information The dataset contains 7,941,282 entries for 16 years. The Dataset contains the following columns:
- ID: Unique identifier for the crime incident.
- Case Number: Records Division Number assigned to the incident.
- Date: Date when the incident occurred.
- Block: Block address of the incident.
- IUCR: The Illinois Uniform Crime Reporting code.
- Primary Type: The primary description of the crime according to the IUCR code.
- Description: Secondary description of the incident.
- Location Description: Description of the location where the incident occurred.
- Arrest: True or False if the convict was arrested.
- Domestic: True or False if the incident was domestic-related.
- Beat: A beat is the smallest police geographic area — each beat has a dedicated police beat car.
- District: District where the incident occurred.
- Ward: The City Council district where the incident occurred.
- Community Area: Chicago has 77 community areas.
- FBI Code: Crime classification according to FBI’s National
- Incident-Based Reporting System (NIBRS).
- X Coordinate: The x coordinate of the incident.
- Y Coordinate: The y coordinate of the incident.
- Year: Year the incident occurred.
- Updated On: Date and time the record was last updated.
- Latitude: The latitude of the incident.
- Longitude: The longitude of the incident.
- Location: The location of the incident
Data Cleaning
1.Data Preprocessing
Missing Values:
Check for missing values in each column. The amount of missing data and its
distribution are crucial factors.For small amounts of missing data, we might
consider imputing missing values using techniques like mean/median imputation,
forward fill, or more sophisticated methods depending on the data type.If a column
has a significant number of missing values and imputation is not feasible, we
might need to remove that column.
Outliers:
Identify outliers in numerical features. Outliers can significantly models.
We might choose to remove outliers if they're considered errors or not representative of the
data. Alternatively, we could use techniques like winsorization to cap outliers to a certain
value.
Inconsistent Values:
inconsistencies in data formats (e.g., date formats, capitalization). Standardize
these formats for consistency.
Checking for typos or spelling errors in categorical data and correcting them for accurate analysis.
2.Data Transformation
Scaling/Normalization
Numerical features often have different scales. For many machine learning models,
it's beneficial to scale them to a common range (e.g., 0-1 or standard deviation of 1).
This ensures features with larger scales don't dominate the model.
Techniques like StandardScaler or Min-Max scaler can be used for normalization.
Categorical Encoding:
Crime data often includes categorical features like crime
type, district, or ward.
These features need to be converted into numerical
representations for machine learning models.
Common techniques include:
One-hot encoding:
Creates a new binary feature for each category
(e.g., one column for each district).
Label encoding: Assigns a numerical value to each category
(e.g., 'District A' = 1, 'District B' = 2).
3.Data Integration
Feature Engineering:
Creating new features from existing ones if they might be more predictive of crime rates.
Examples include:
Combining features (e.g., 'Year' + 'Month' for a specific time period)
Deriving new features (e.g., population density based on additional data)
4.Data Reduction
Dimensionality Reduction
in case of very large number of features, dimensionality reduction techniques may be
necessary:
Principal Component Analysis (PCA) can reduce the number of features while preserving
most of the information.
Feature selection methods (e.g., SelectKBest) can select a subset of features based on
their importance
Algorithms Used
FbProphet
The Facebook prophet is a time series forecasting model, which at its core is an
additive regression model. It works well with data having strong seasonal effects
and several seasons of historical data. The Prophet is also robust to outliers,
missing data, and dramatic change in time series. Prophet provides two main
advantages as compared to other forecasting models, Prophet makes it much
more straightforward to create a reasonable, accurate forecast and
Prophet forecasts are customizable in ways that are intuitive to
non-experts.
Four main components of FbProphet include:
- Piecewise linear or logistic growth curve trend. Prophet automatically detects changes in trends by selecting changepoints from the data.
- Yearly seasonal component modeled using Fourier series.
- Weekly seasonal component using dummy variables.
- User-provided list of important holiday
Flow Chart
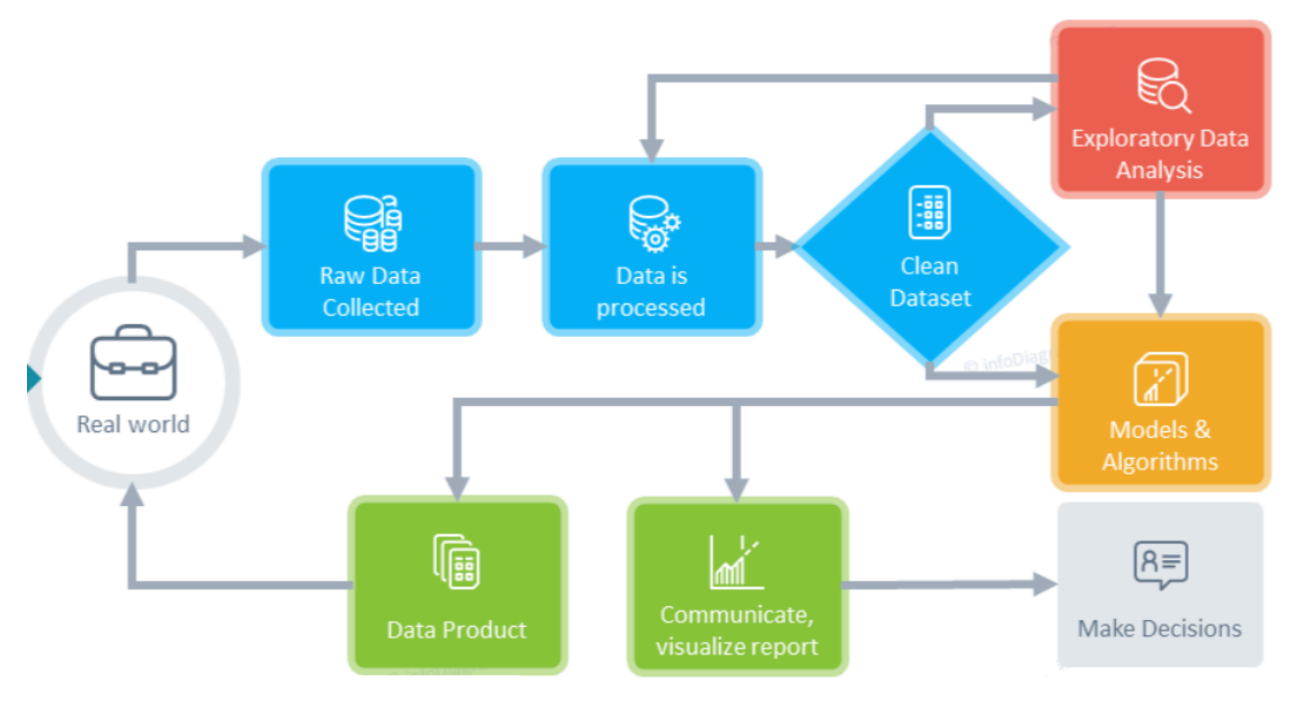
Methodology
Importing Required Libraries
The code starts by importing necessary libraries such as pandas, matplotlib, seaborn, and fbprophet.
Reading and Preprocessing Data:
- It reads crime data from three CSV files corresponding to different time periods
(2005-2007, 2008-2011, and 2012-2017).
- The data from these files is concatenated into a single dataframe.
- The dataframe is then examined, checking its dimensions, information, and the
presence of any null values.
- Necessary columns are selected for further analysis (ID, Date, Primary Type, Location
Description, Arrest, Domestic).
- Null values are dropped from the dataframe.
- The 'Date' column is converted to datetime format, assuming a specific date-time
format.
Exploratory Data Analysis (EDA)
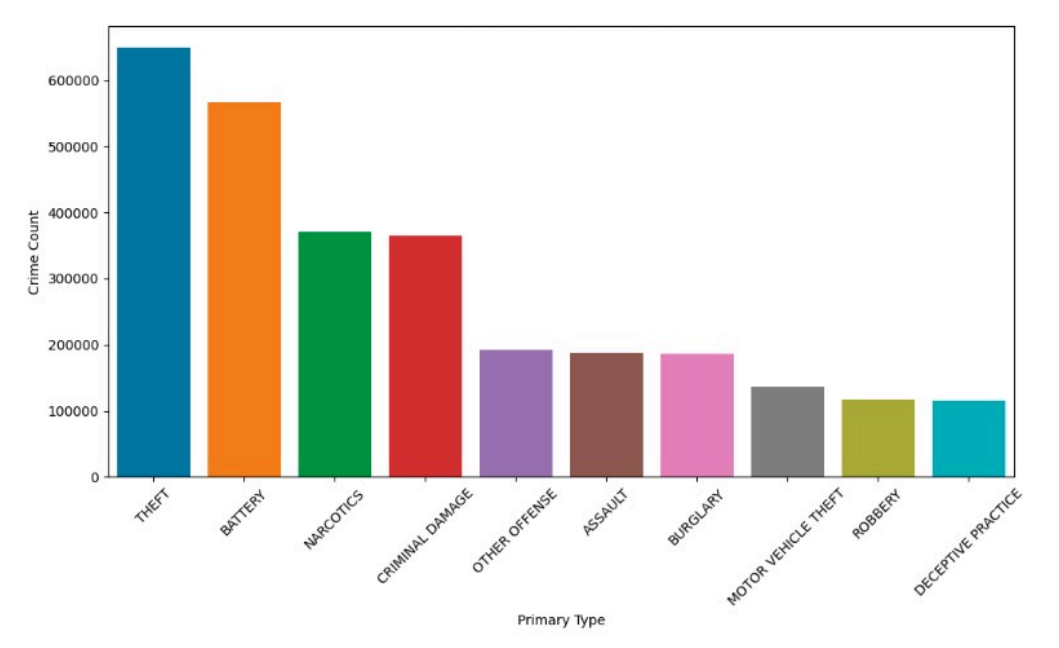
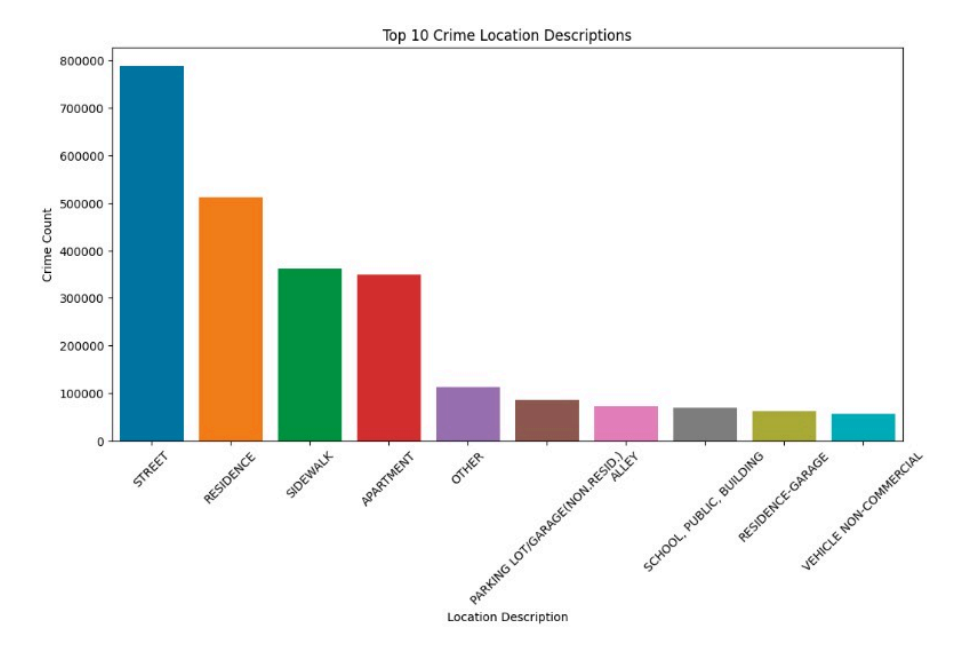
- The top 10 primary crime types and top 10 crime location descriptions are identified
using value counts.
- The data is resampled to get the monthly crime count.
Prophet Model Training and Forecasting
- A Prophet model is initialized and fitted to the monthly crime count data.
- Future predictions are made using the trained model for the next 24 months.
Visualization
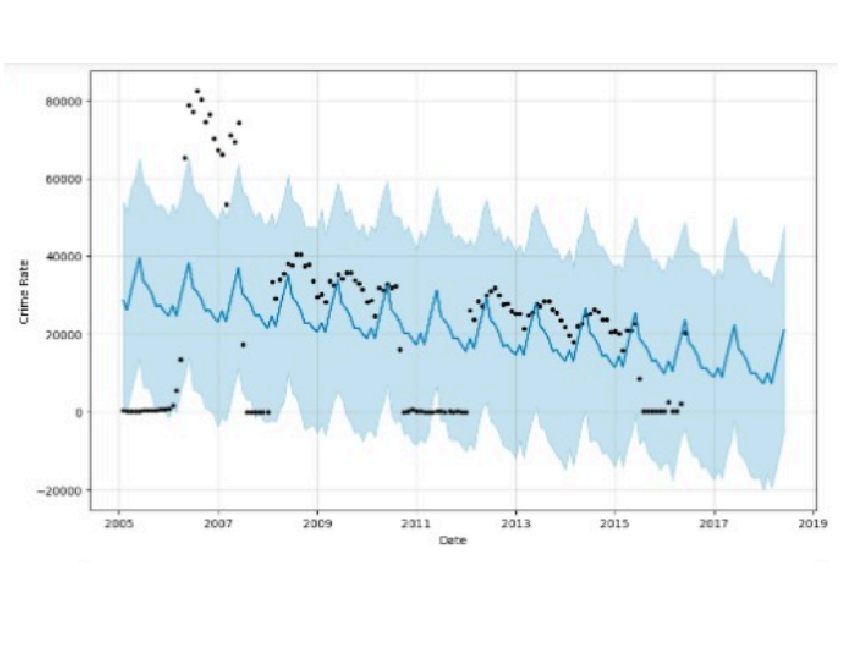
- The forecasted crime rate is plotted using Prophet's plot function. - Additionally, a boxplot is generated to show the fluctuation in the monthly average crime counts over the last 10 years. This is done using seaborn's boxplot function.
Interpretation
- The generated plots provide insights into the forecasted crime rate trend and the variability in the monthly crime counts over the last decade. They can help in understanding patterns and making informed decisions related to crime prevention and law enforcement.
Output
The Output Shows the following
- Top 10 Primary Crime Types
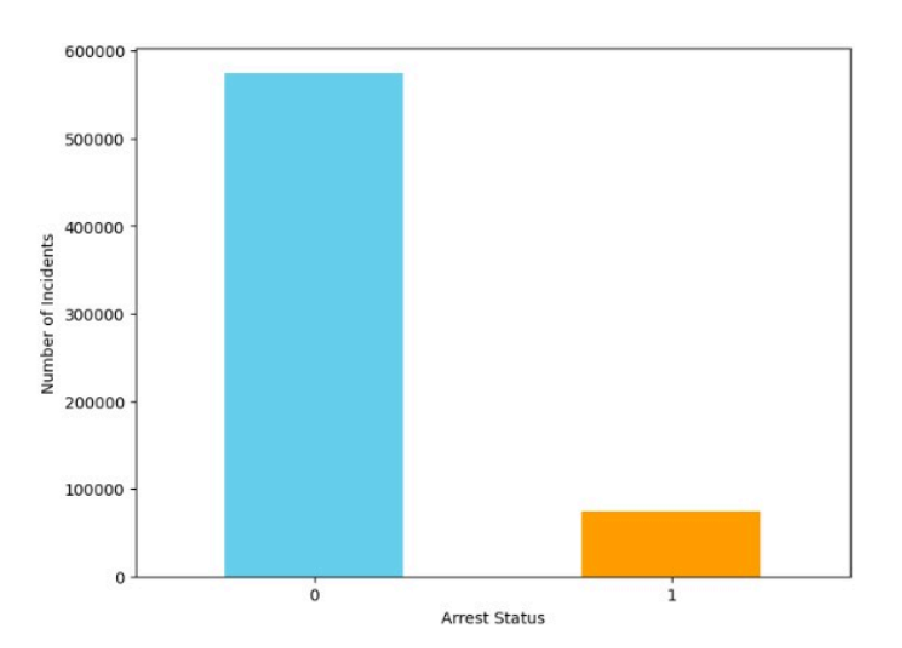
- How Many Criminals Are Arrested Having Primary Crime type is Theft?
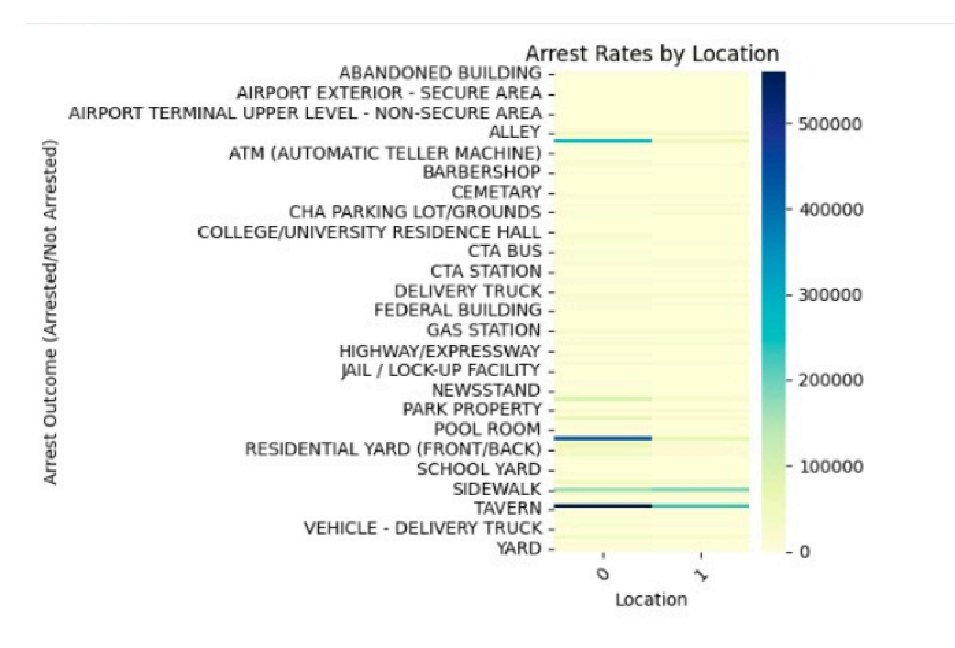
- The Top 10 Crime Location Descriptions
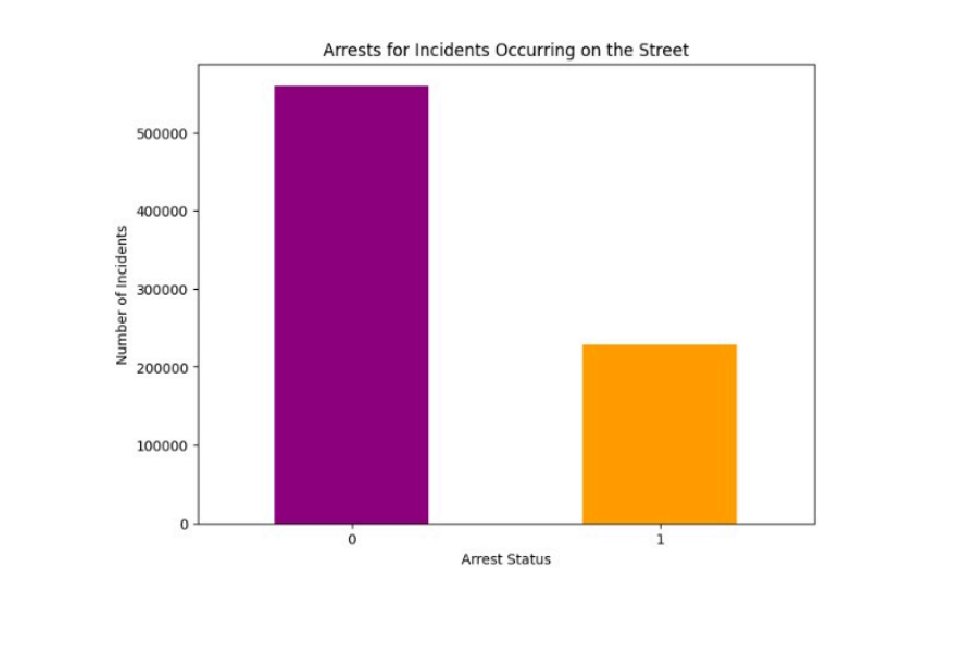
- How Many Are Arrested Having Location Type is STREET?
- The Top 10 Crime Location Descriptions
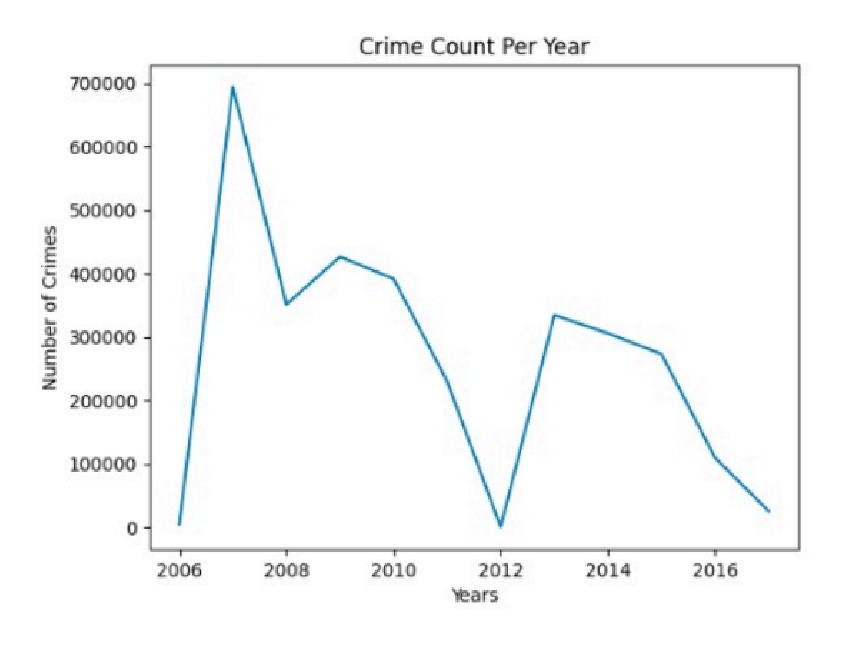
- Forecast(without FBprophet)
- Forecast for 2 years (with FBprophet)
Conclusion
predicted accurately the trend of the crimes committed in Chicago for the next two years, that is 2018 and 2019.From the results it is clear that the number of crimes committed in Chicago has decreased and is expected to fall further, which is a good thing since it means that Chicago is becoming safer with time. Our initial conclusion drawn which says that the crime has decreased over time is verified by the fbprophet model, confirming its accuracy. As crime rates in Chicago are falling, we can further decrease it by implementing safety measures and making sure the felonies are reported properly. Fbrpophet is considered as a very convenient approach for making predictions on time series data and this paper verifies its claim. The model can be used to predict the crime rate for any other city in the world, given that the dataset is available on the internet. With the help of this model,we can know which crimes are committed the most,where they are committed the most and which need immediate attention so as to decrease the number of crimes committed in the future.